
Tracing
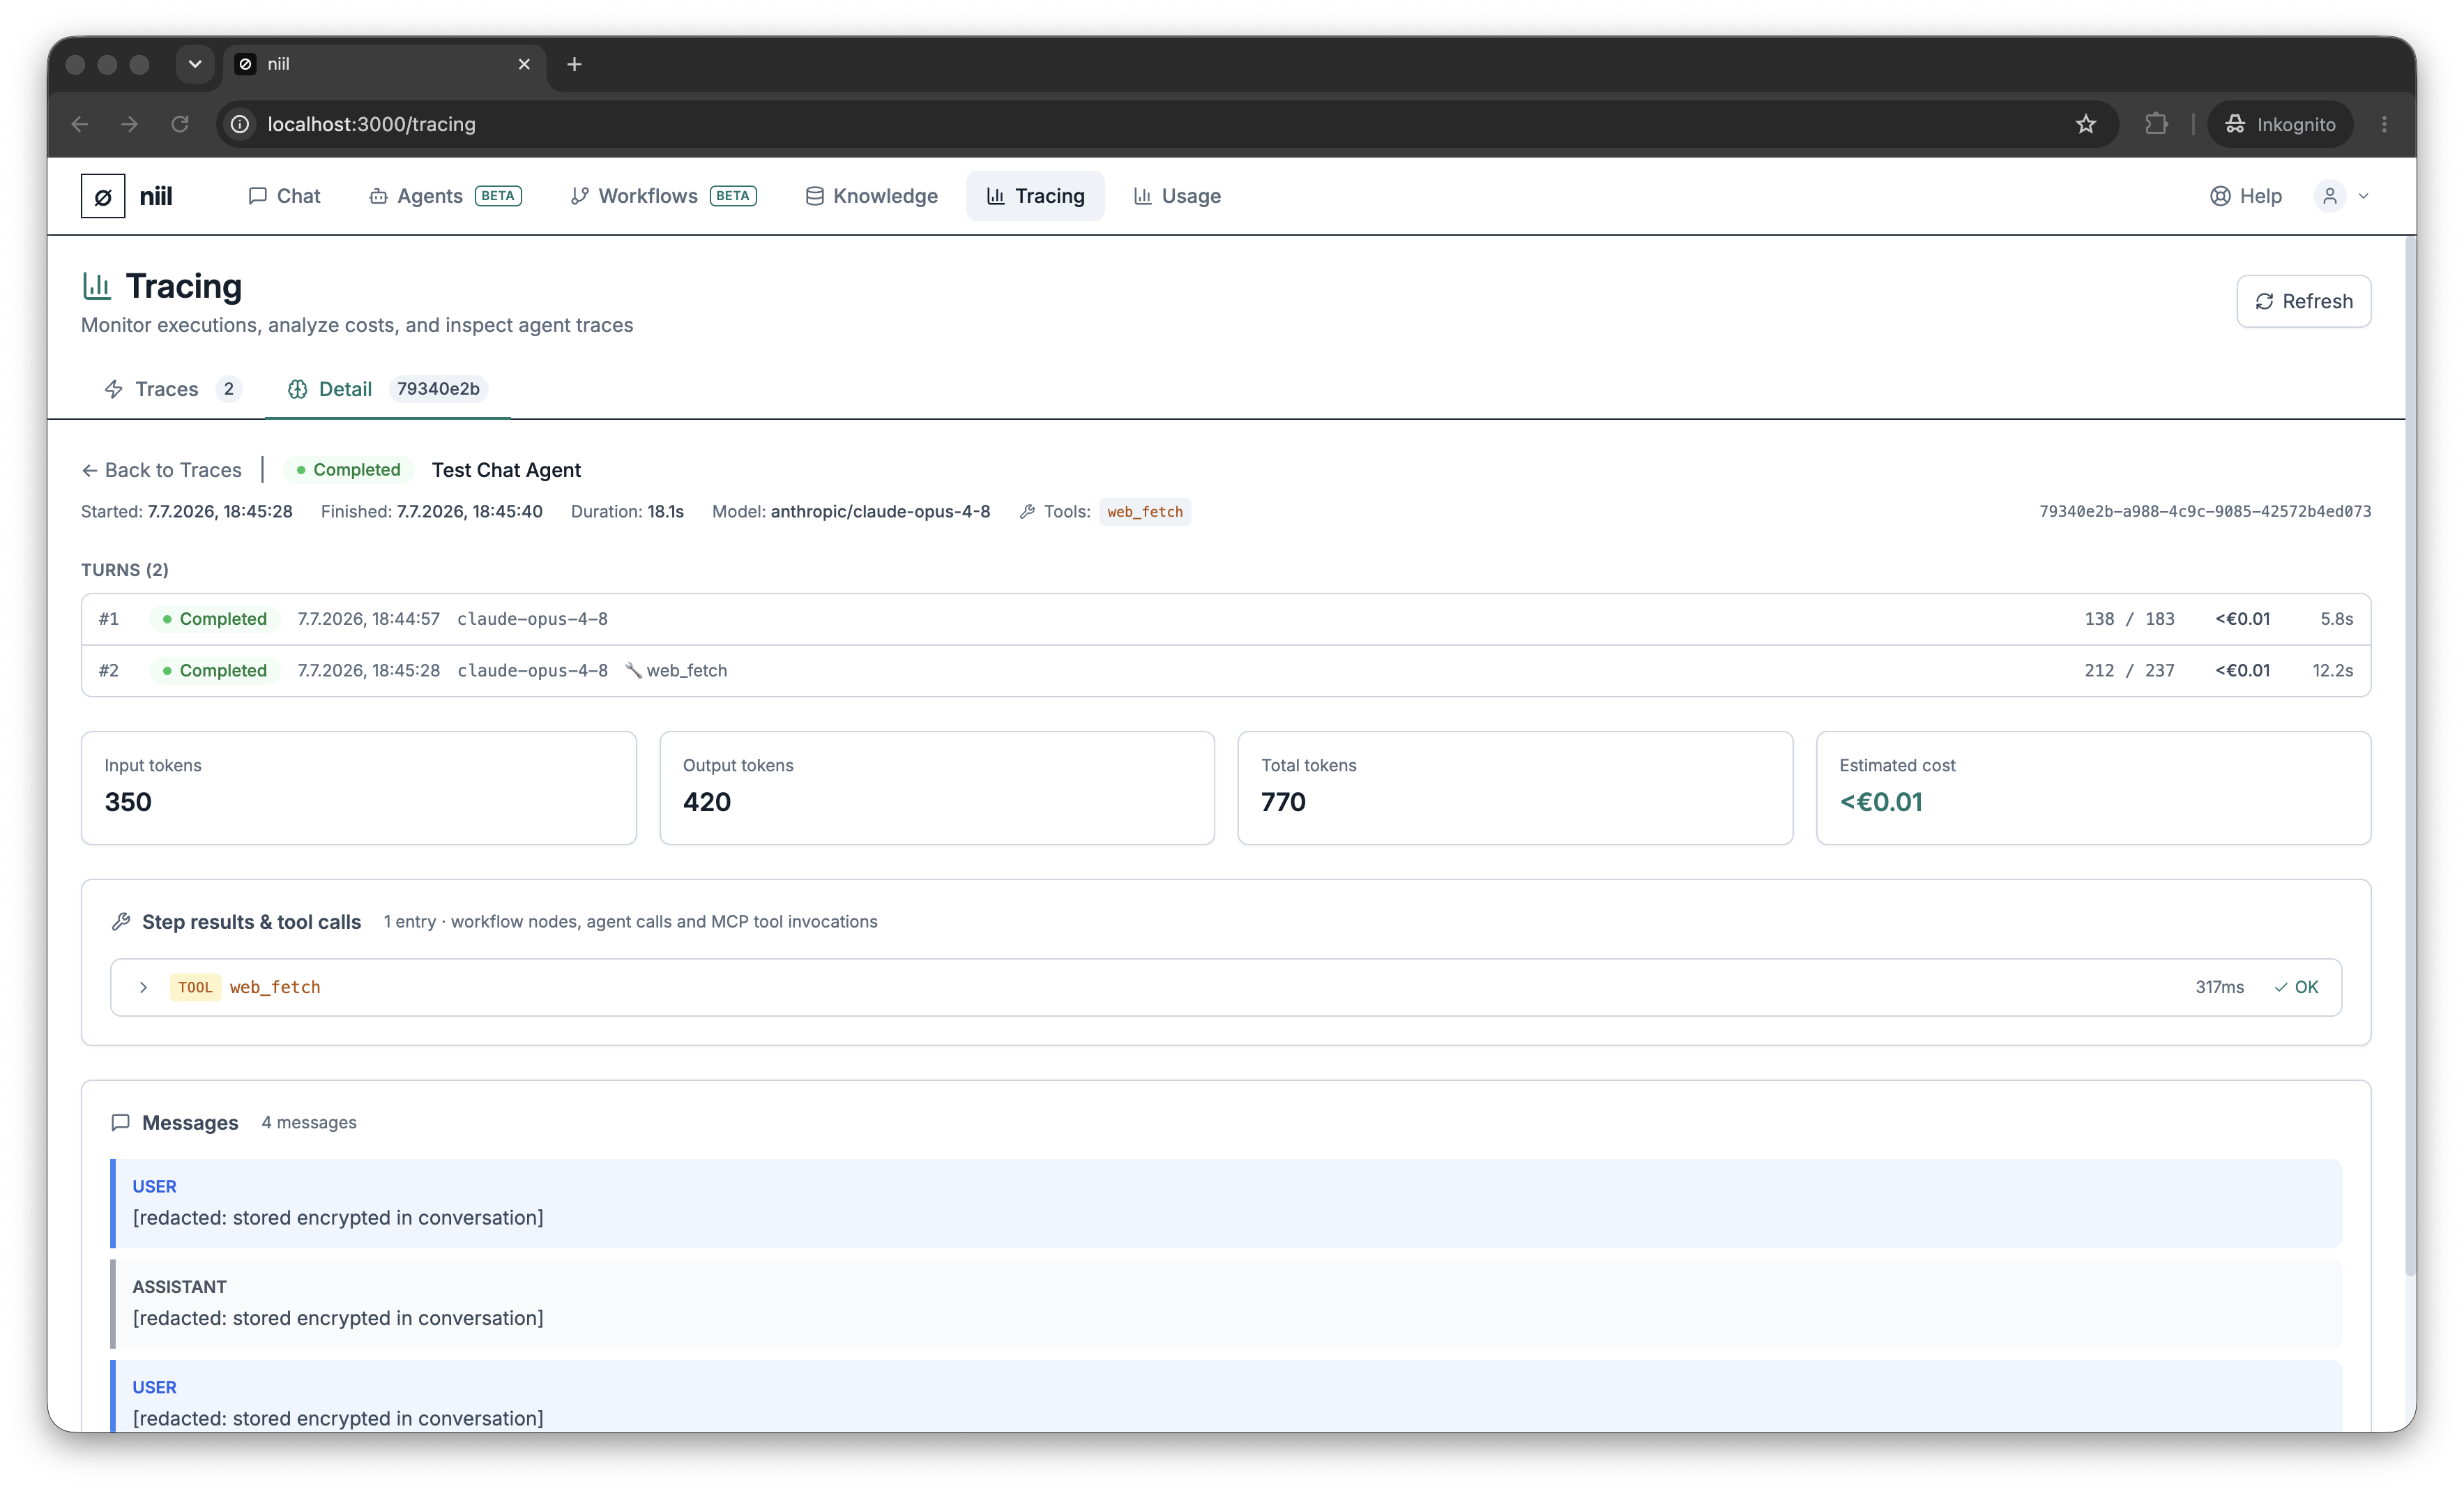
Tracing is where you see what your agents and workflows actually did: every run (a "trace") with its status, duration, token usage, and cost — and, for a single run, the full step tree, tool calls, and each sub-agent's contribution.
The traces list
The Traces tab lists recent runs, one row each:
- Status — running / completed / failed.
- Agent and provider / model.
- Duration, tokens, and cost (EUR).
- When it ran.
Narrow the list with the time range (1h / 24h / 7d / 30d), the status filter, an agent filter, and a search box.
A single trace
Select a run — or use the open-in-Tracing action next to a run in a workflow's run inspector — to open its detail: the step timeline with per-step token usage and cost, the tool calls made, and, for agent orchestrations, each sub-agent's individual contribution (these don't appear as separate chat messages).
Cost & tokens
Every trace shows the same billed cost that rolls up on the Usage page — tracing is the per-run breakdown behind those totals. Model calls, tool/web-search use, knowledge embeddings, and delegated sub-agents all appear here, so you can see exactly where a run spent time and money.