
Running a workflow
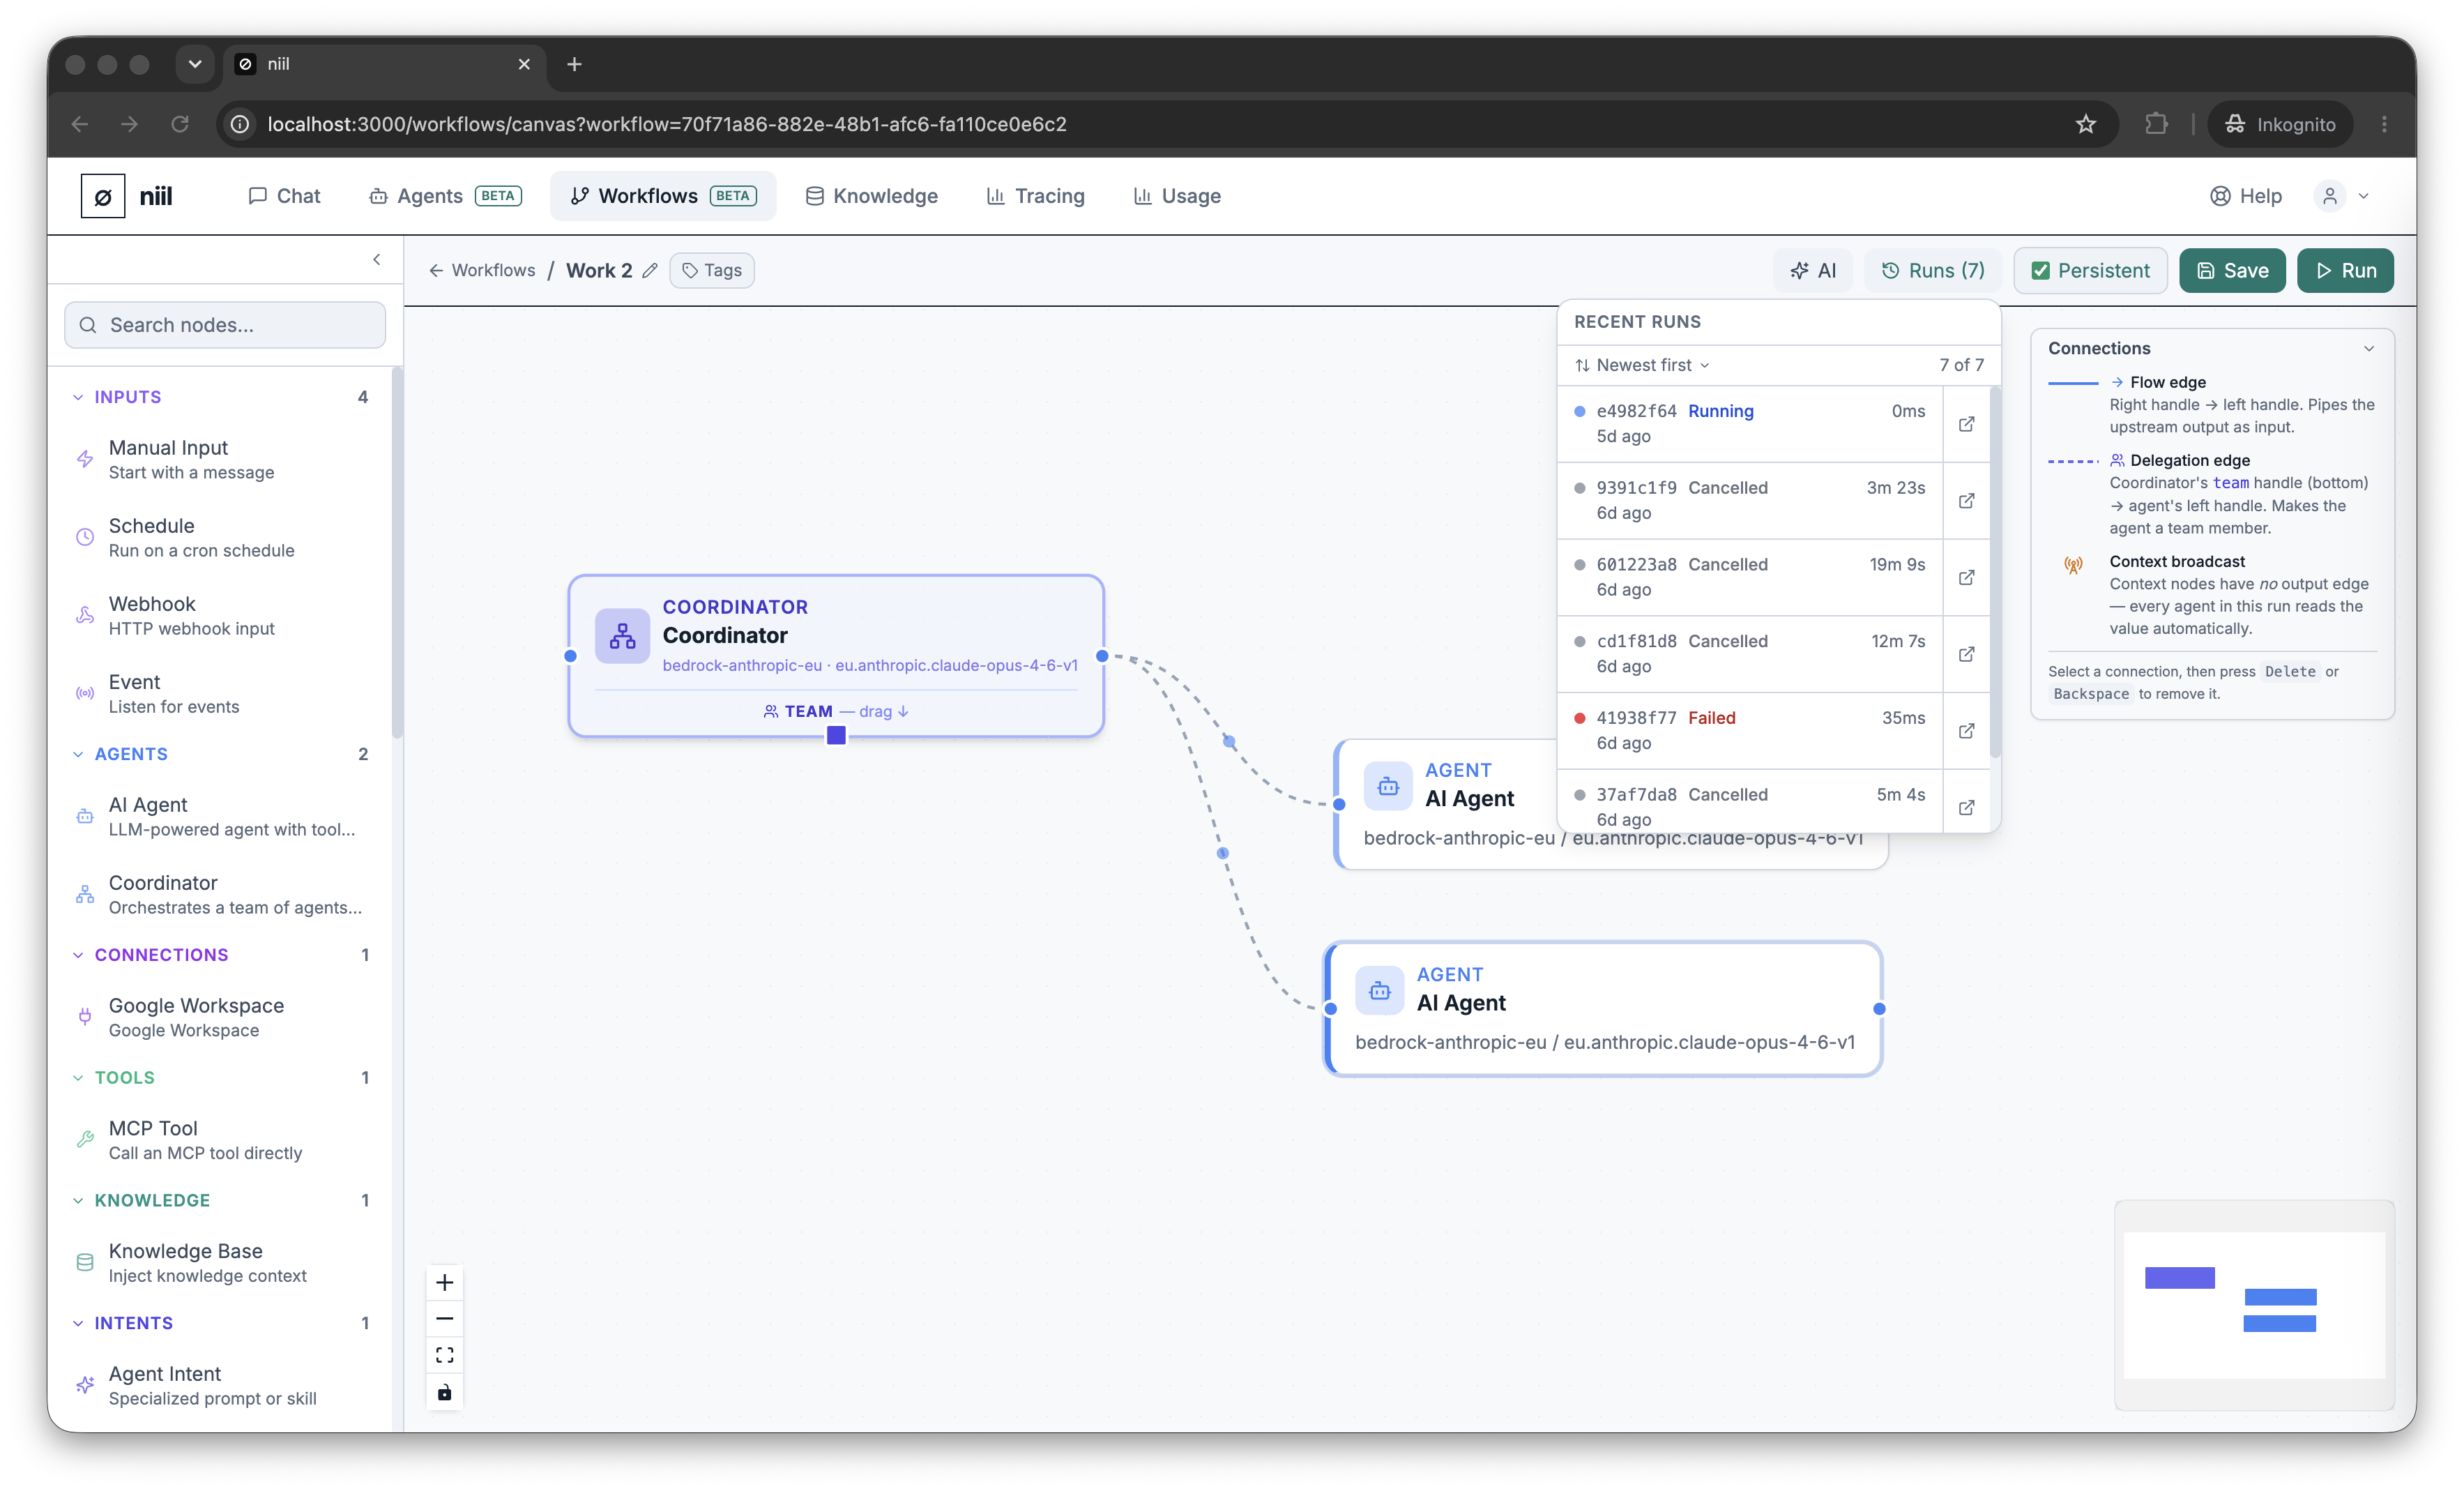
Press Run on the canvas to execute the workflow. The run inspector drawer opens at the bottom.
The run inspector
- A node timeline on the left lists each node with its status (running / success / skipped / error) and duration.
- Selecting a node shows its output and details on the right.
- Live output streams in as the run proceeds.
Recent runs & Tracing
The Runs dropdown lists recent executions of this workflow. Pick one to inspect it, or use the open-in-Tracing action next to a run to jump to its full trace on the Tracing page — where you'll find the complete step tree, token usage, cost, tool calls, and (for orchestrations) each sub-agent's contribution.
Reading statuses
- success / error — the node ran and its result.
- skipped — the node didn't need to run on this path. For a coordinator's team members you'll see a "team member — invoked on demand" note; that's normal, they run only when the coordinator delegates to them.